Frohes Neues Jahr, ihr FOAMer!
Ich habe mir pyFoam installiert, um die logs beobachte zu können.
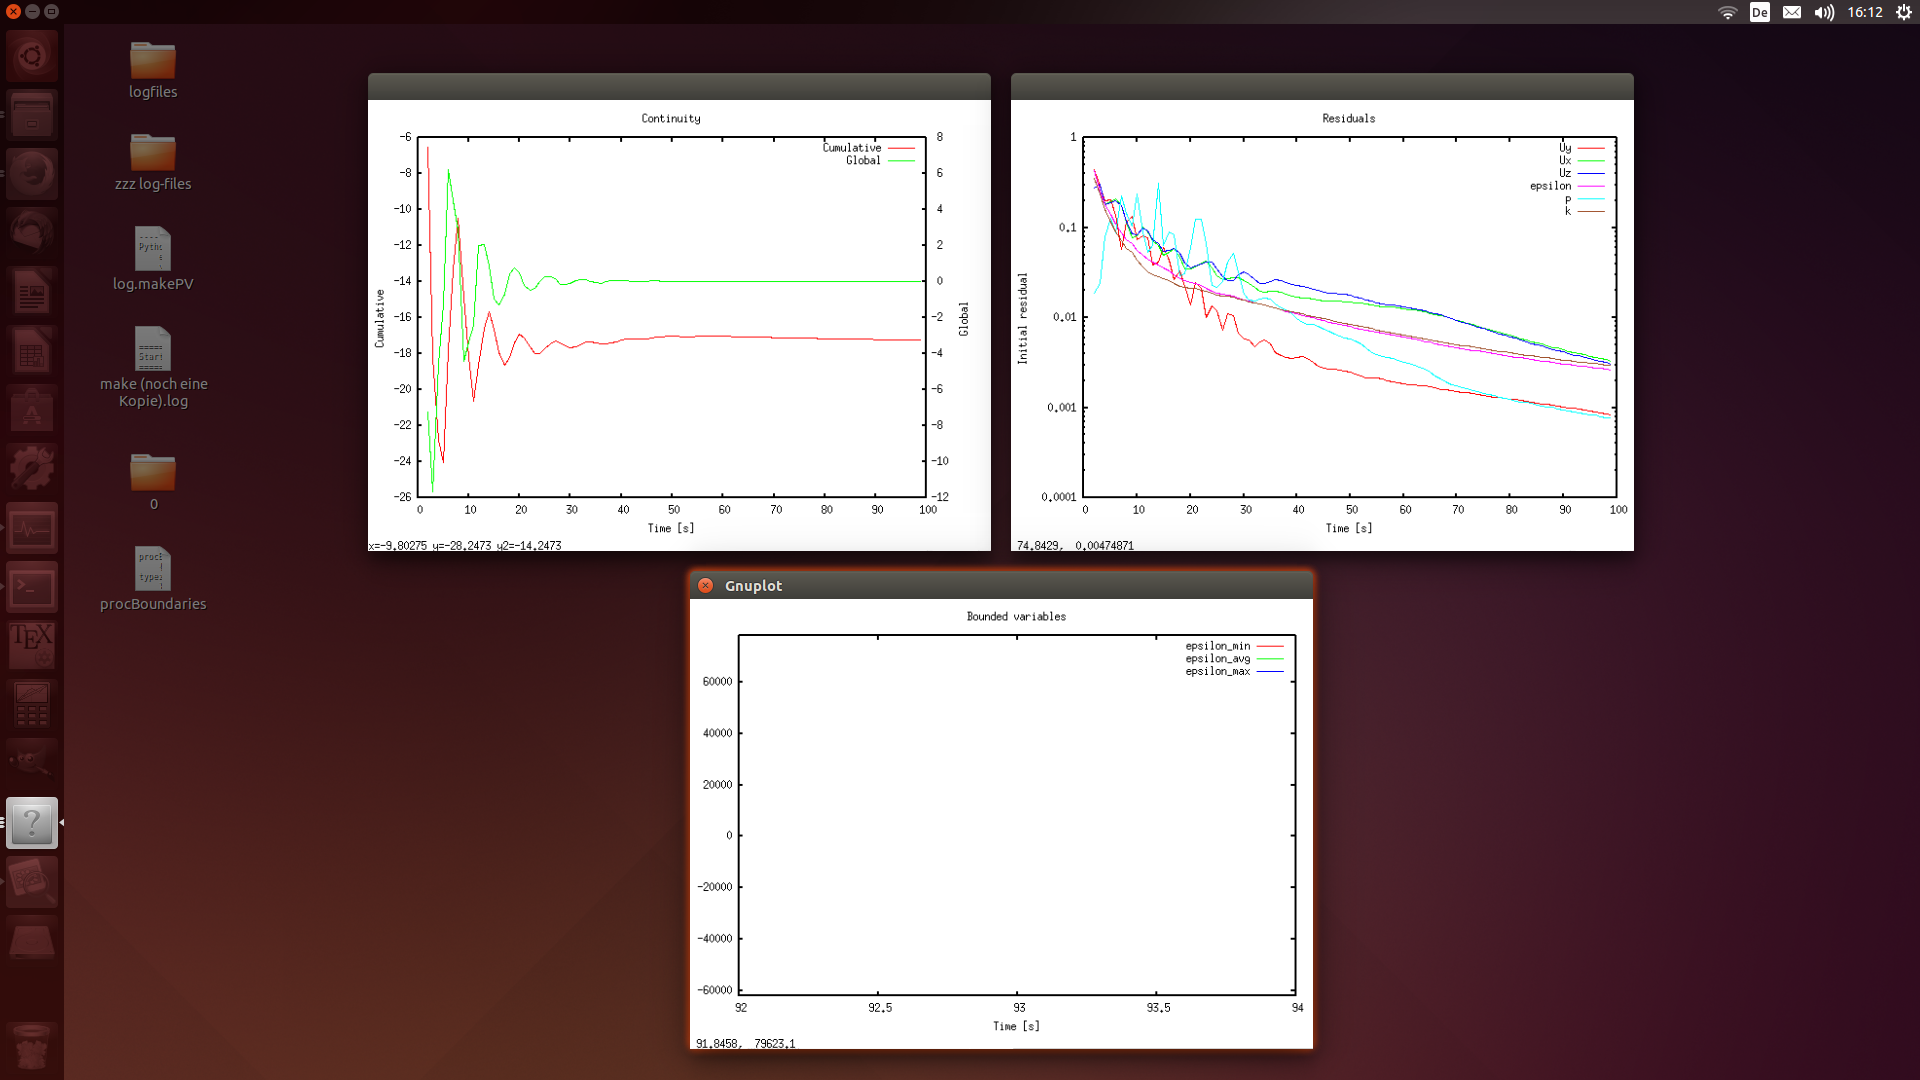
Wenn ich jetzt meinen Fall (100 Iterationen) durchlaufen lasse, gibt er mir zunächst keine Fehler aus, es öffnet sich ein Plot für Continuity und Residuals.
Ab Time = 85 erscheint folgende Meldung:
Zitat:
gnuplot> plot
^
line 0: function to plot expected
smoothSolver: Solving for Ux, Initial residual = 0.00531171134, Final residual = 0.000394192378, No Iterations 2
smoothSolver: Solving for Uy, Initial residual = 0.00112782152, Final residual = 8.44206918e-05, No Iterations 2
smoothSolver: Solving for Uz, Initial residual = 0.00504881, Final residual = 0.000370881269, No Iterations 2
GAMG: Solving for p, Initial residual = 0.00107348694, Final residual = 9.76647708e-05, No Iterations 2
time step continuity errors : sum local = 0.0328907655, global = -0.00406447429, cumulative = -17.1887729
smoothSolver: Solving for epsilon, Initial residual = 0.00337657086, Final residual = 0.000115351146, No Iterations 3
smoothSolver: Solving for k, Initial residual = 0.00370231681, Final residual = 0.000132322924, No Iterations 3
ExecutionTime = 452.4 s ClockTime = 454 s
Bei Time = 94 erscheint:
Zitat:
Time = 94
Warning: empty x range [93:93], adjusting to [92.07:93.93]smoothSolver: Solving for Ux, Initial residual = 0.00387799649, Final residual = 0.000287083688, No Iterations 2
smoothSolver: Solving for Uy, Initial residual = 0.000936174023, Final residual = 7.04901877e-05, No Iterations 2
smoothSolver: Solving for Uz, Initial residual = 0.00364435105, Final residual = 0.000266945123, No Iterations 2
GAMG: Solving for p, Initial residual = 0.000849422473, Final residual = 8.09024797e-05, No Iterations 2
time step continuity errors : sum local = 0.0286598347, global = -0.00361009025, cumulative = -17.2234809
smoothSolver: Solving for epsilon, Initial residual = 0.00286325274, Final residual = 9.79260651e-05, No Iterations 3
smoothSolver: Solving for k, Initial residual = 0.00317715509, Final residual = 0.000114005532, No Iterations 3
line 0: warning: Skipping unreadable file "/tmp/tmpdwo9mB.gnuplot/fifo"
line 0: warning: Skipping unreadable file "/tmp/tmpStJbMq.gnuplot/fifo"
line 0: warning: Skipping unreadable file "/tmp/tmpf7G8oO.gnuplot/fifo"
line 0: No data in plot
line 0: warning: Skipping unreadable file "/tmp/tmpdwo9mB.gnuplot/fifo"
line 0: warning: Skipping unreadable file "/tmp/tmpStJbMq.gnuplot/fifo"
line 0: warning: Skipping unreadable file "/tmp/tmpf7G8oO.gnuplot/fifo"
line 0: No data in plot
line 0: warning: Skipping unreadable file "/tmp/tmpdwo9mB.gnuplot/fifo"
line 0: warning: Skipping unreadable file "/tmp/tmpStJbMq.gnuplot/fifo"
line 0: warning: Skipping unreadable file "/tmp/tmpf7G8oO.gnuplot/fifo"
line 0: No data in plot
ExecutionTime = 499.58 s ClockTime = 501 s
Gleichzeitig erscheint ein dritter Plot: "Bounded Variables", der jedoch leer bleibt.
Mit Iteration 95 läuft alles wieder wie am Anfang.
Nachdem in der log-Datei nur die Ergebnisse auftauchen, aber keine dieser Fehlermeldungen, gehe ich davon aus dass der Solver nichts damit zu tun hat (sondern eher gnuplot, siehe Iteration 85). Aber kann mir jemand erklären, warum das so ist?
------------------
...im CAD hats gepasst.
Eine Antwort auf diesen Beitrag verfassen (mit Zitat/Zitat des Beitrags) IP

 Foren auf CAD.de


 |
|